ZeuZ Platform 20250518

Release date: May 18, 2025
Welcome to the May 2025 release of the ZeuZ platform! 🚀 We're thrilled to introduce several powerful updates that will enhance your testing experience. Key highlights include:
Features
- ✨ Seamless ZeuZ Node connection
- 🔍 AI-Powered Mobile inspector
- 🔮 Variable viewer in Debug page
- 📊 AI-Powered Release report summary
- 🔄 Pre-requisite test case functionality
- 🔁 Rerun existing RunID capability
- 📈 Fail analysis reporting
Bug Fixes
- Fixed report generation issues when GitHub integration is missing in Testing > Reports > Release Report
- Resolved step section slider visibility problems in Testing > Testcase > Create Testcase caused by table insertions in Description or Expected fields
- Corrected global attachments scope
- Fixed Build-to-Build comparison bugs in Testing > Reports > Execution
Enhancements
- Improved assignee user search functionality in Testing > Reports > Fail Analysis
- Optimized page load time and performance in Testing > History
- Fixed incorrect team/project feature display in Project > Create/Edit > Task, Bug & Requirement pages
- Enhanced UI in Testing > Deployments > History & Set page
- Restricted Datastore access by team/project for better security
- Streamlined GitHub issue linking process
- Updated Run Queue feature and UI in Testing > Deployments > History
- Added Storybook Integration for UI Components
- Enhanced Donut Charts and fixed Total Value in Testing > Deployments > Set/History
- Implemented Automatic Default Filter for Fail Analysis Report
- Redesigned border color for clarity in Testing > Reports > Fail Analysis
- Updated Run History border color to reflect test case status in Testing > Test case edit pages
Seamless ZeuZ Node Connection
Connect your ZeuZ Node effortlessly without the hassle of launching a terminal or copying and pasting commands. The process is now completely streamlined!
View the accompanying ZeuZ Node release
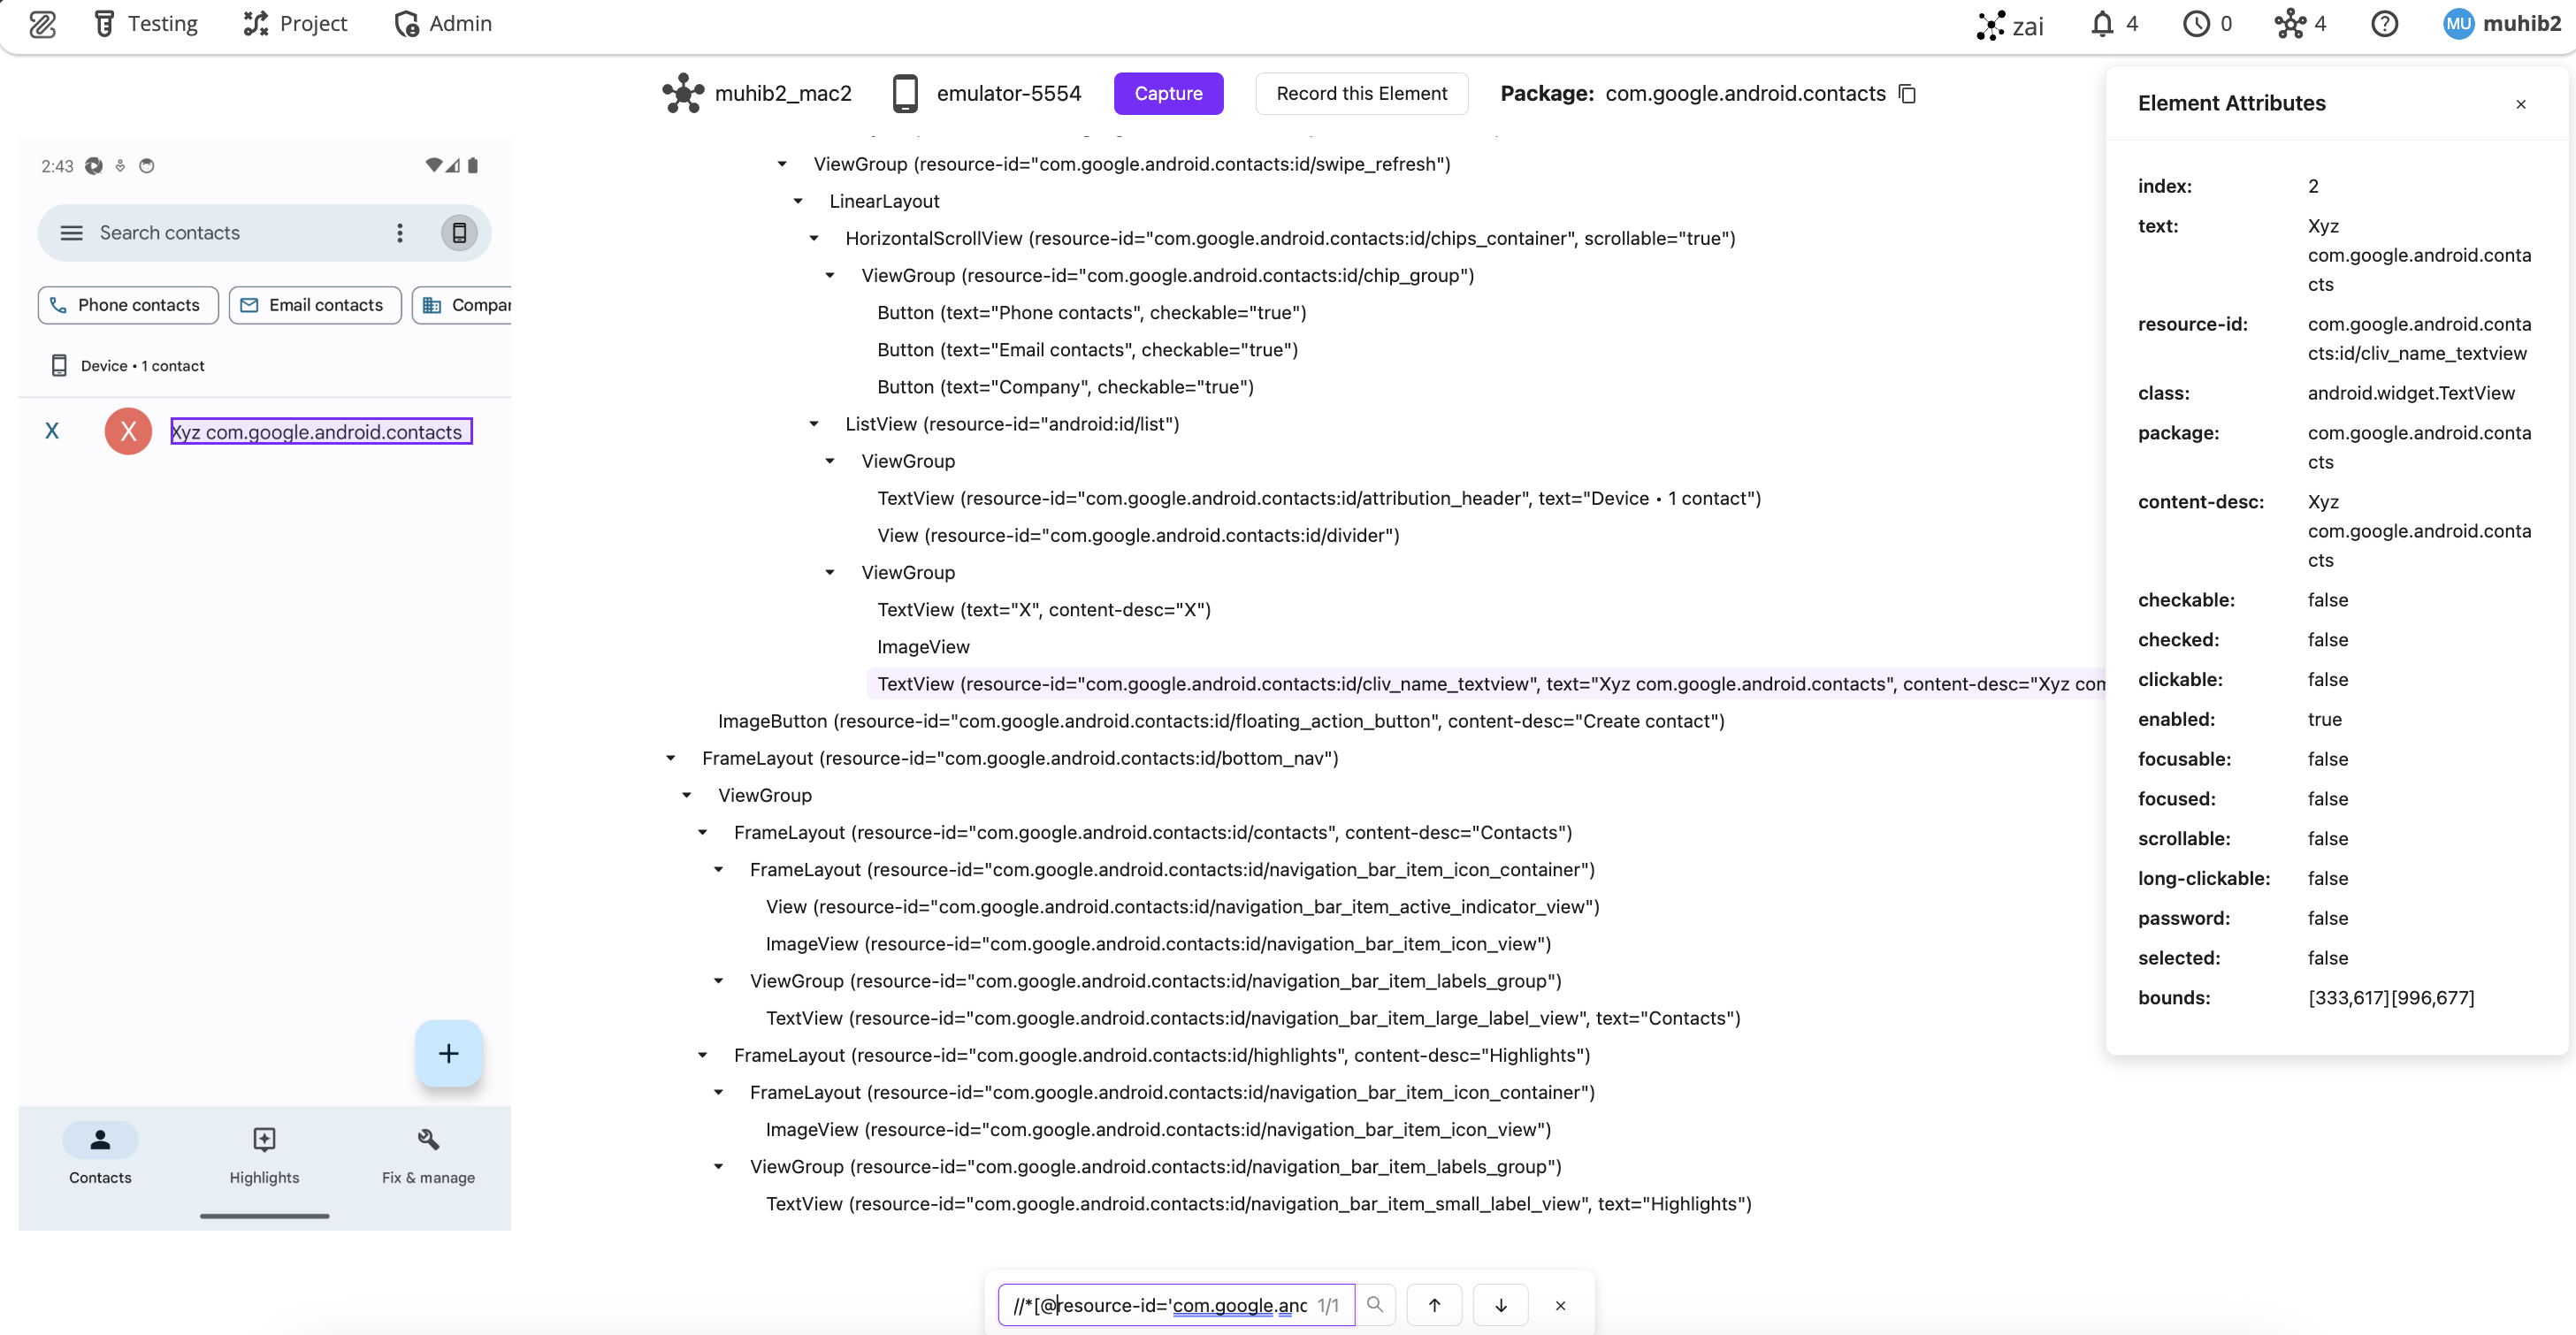
AI-Powered Mobile Inspector
Inspect Android™ applications directly within ZeuZ Server without installing additional tools like Appium Inspector or Android uiautomatorviewer.
Say goodbye to hours of setup frustration! Simply connect your mobile device or launch an emulator, run ZeuZ Node, and connect to ZeuZ Server. Everything else is handled automatically. This also solves a persistent challenge:
No more restarting the adb server after each inspection through Appium/uiautomatorviewer.
Features:
- Enhanced Screenshot and Element Tree Detection: Improved accuracy in detecting and displaying UI elements
- Dedicated Attribute List Panel: Right-side panel for comprehensive element attribute inspection
- Powerful Search Functionality: Use Ctrl+F to search by CSS, XPath, or value
- Dual DOM Support: Both ADB and Appium now provide DOM access, eliminating inspection barriers when the Appium server is active
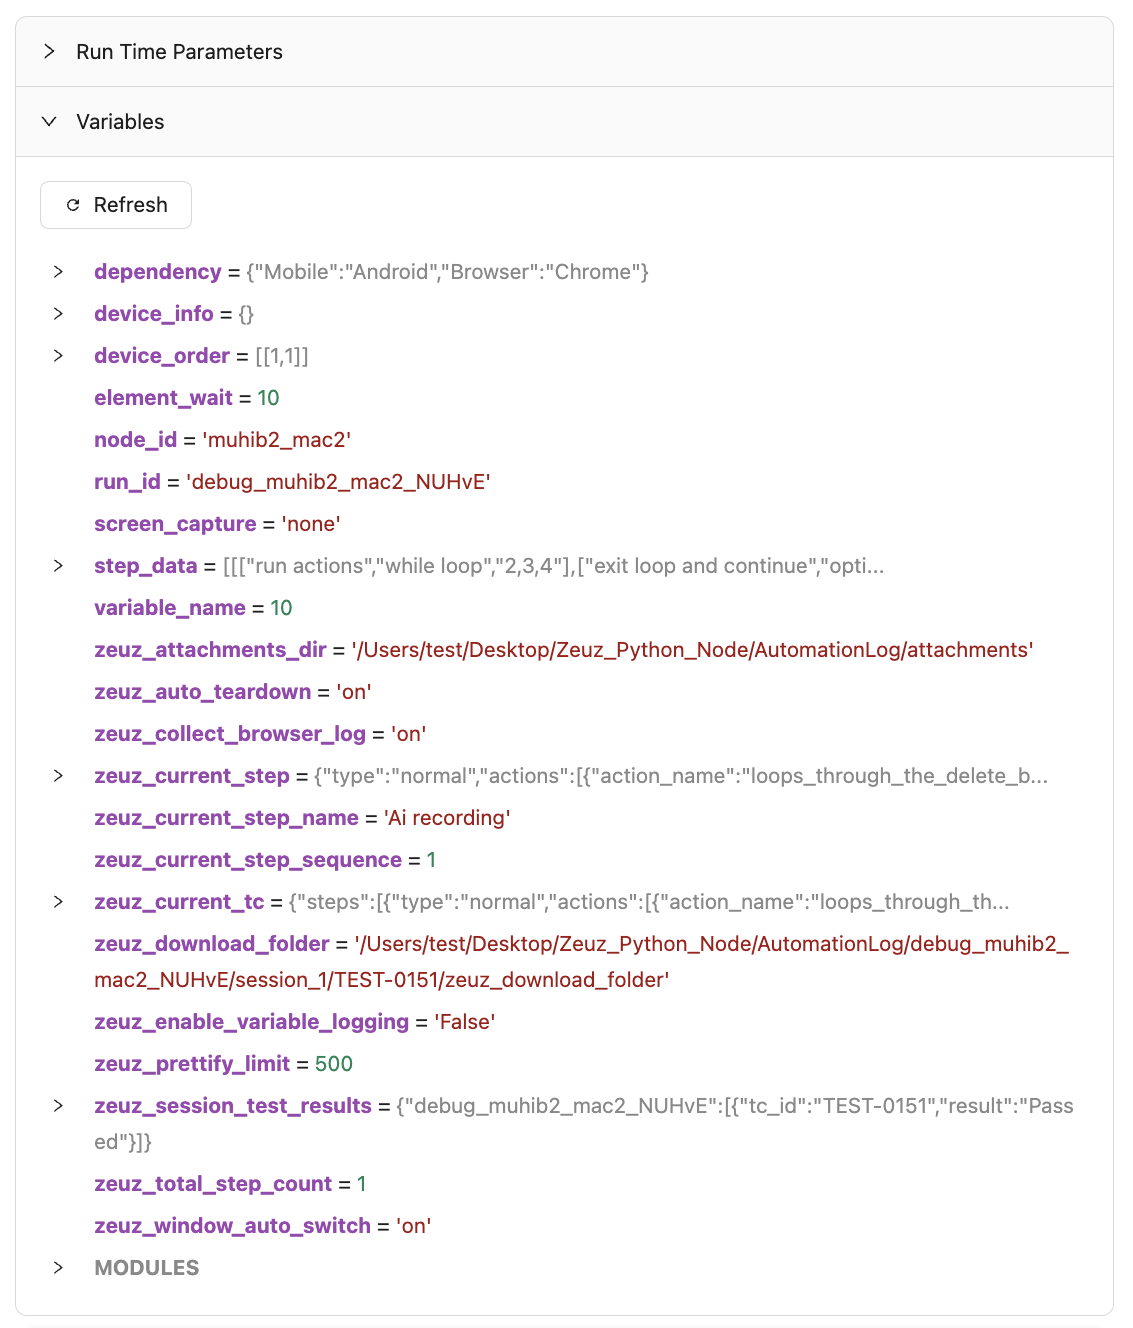
Variable Viewer in Debug Page
When debugging test cases, users often need to inspect current ZeuZ node variables to build further actions. Our new hierarchical tree view of variables provides a clean, intuitive interface for navigating complex data structures. Variables are displayed in three distinct formats:
- JSON Object Variables: Standard JSON-compatible variables with reasonably sized values
- JSON Schema Variables: Large JSON variables truncated for readability and presented as schemas
- Non-JSON Variables: Non-JSON objects (e.g., Python modules, WebDriver instances, WebDriver elements) with up to 200 properties displayed
- Oversized Values: Variables with excessively large values are omitted for performance optimization
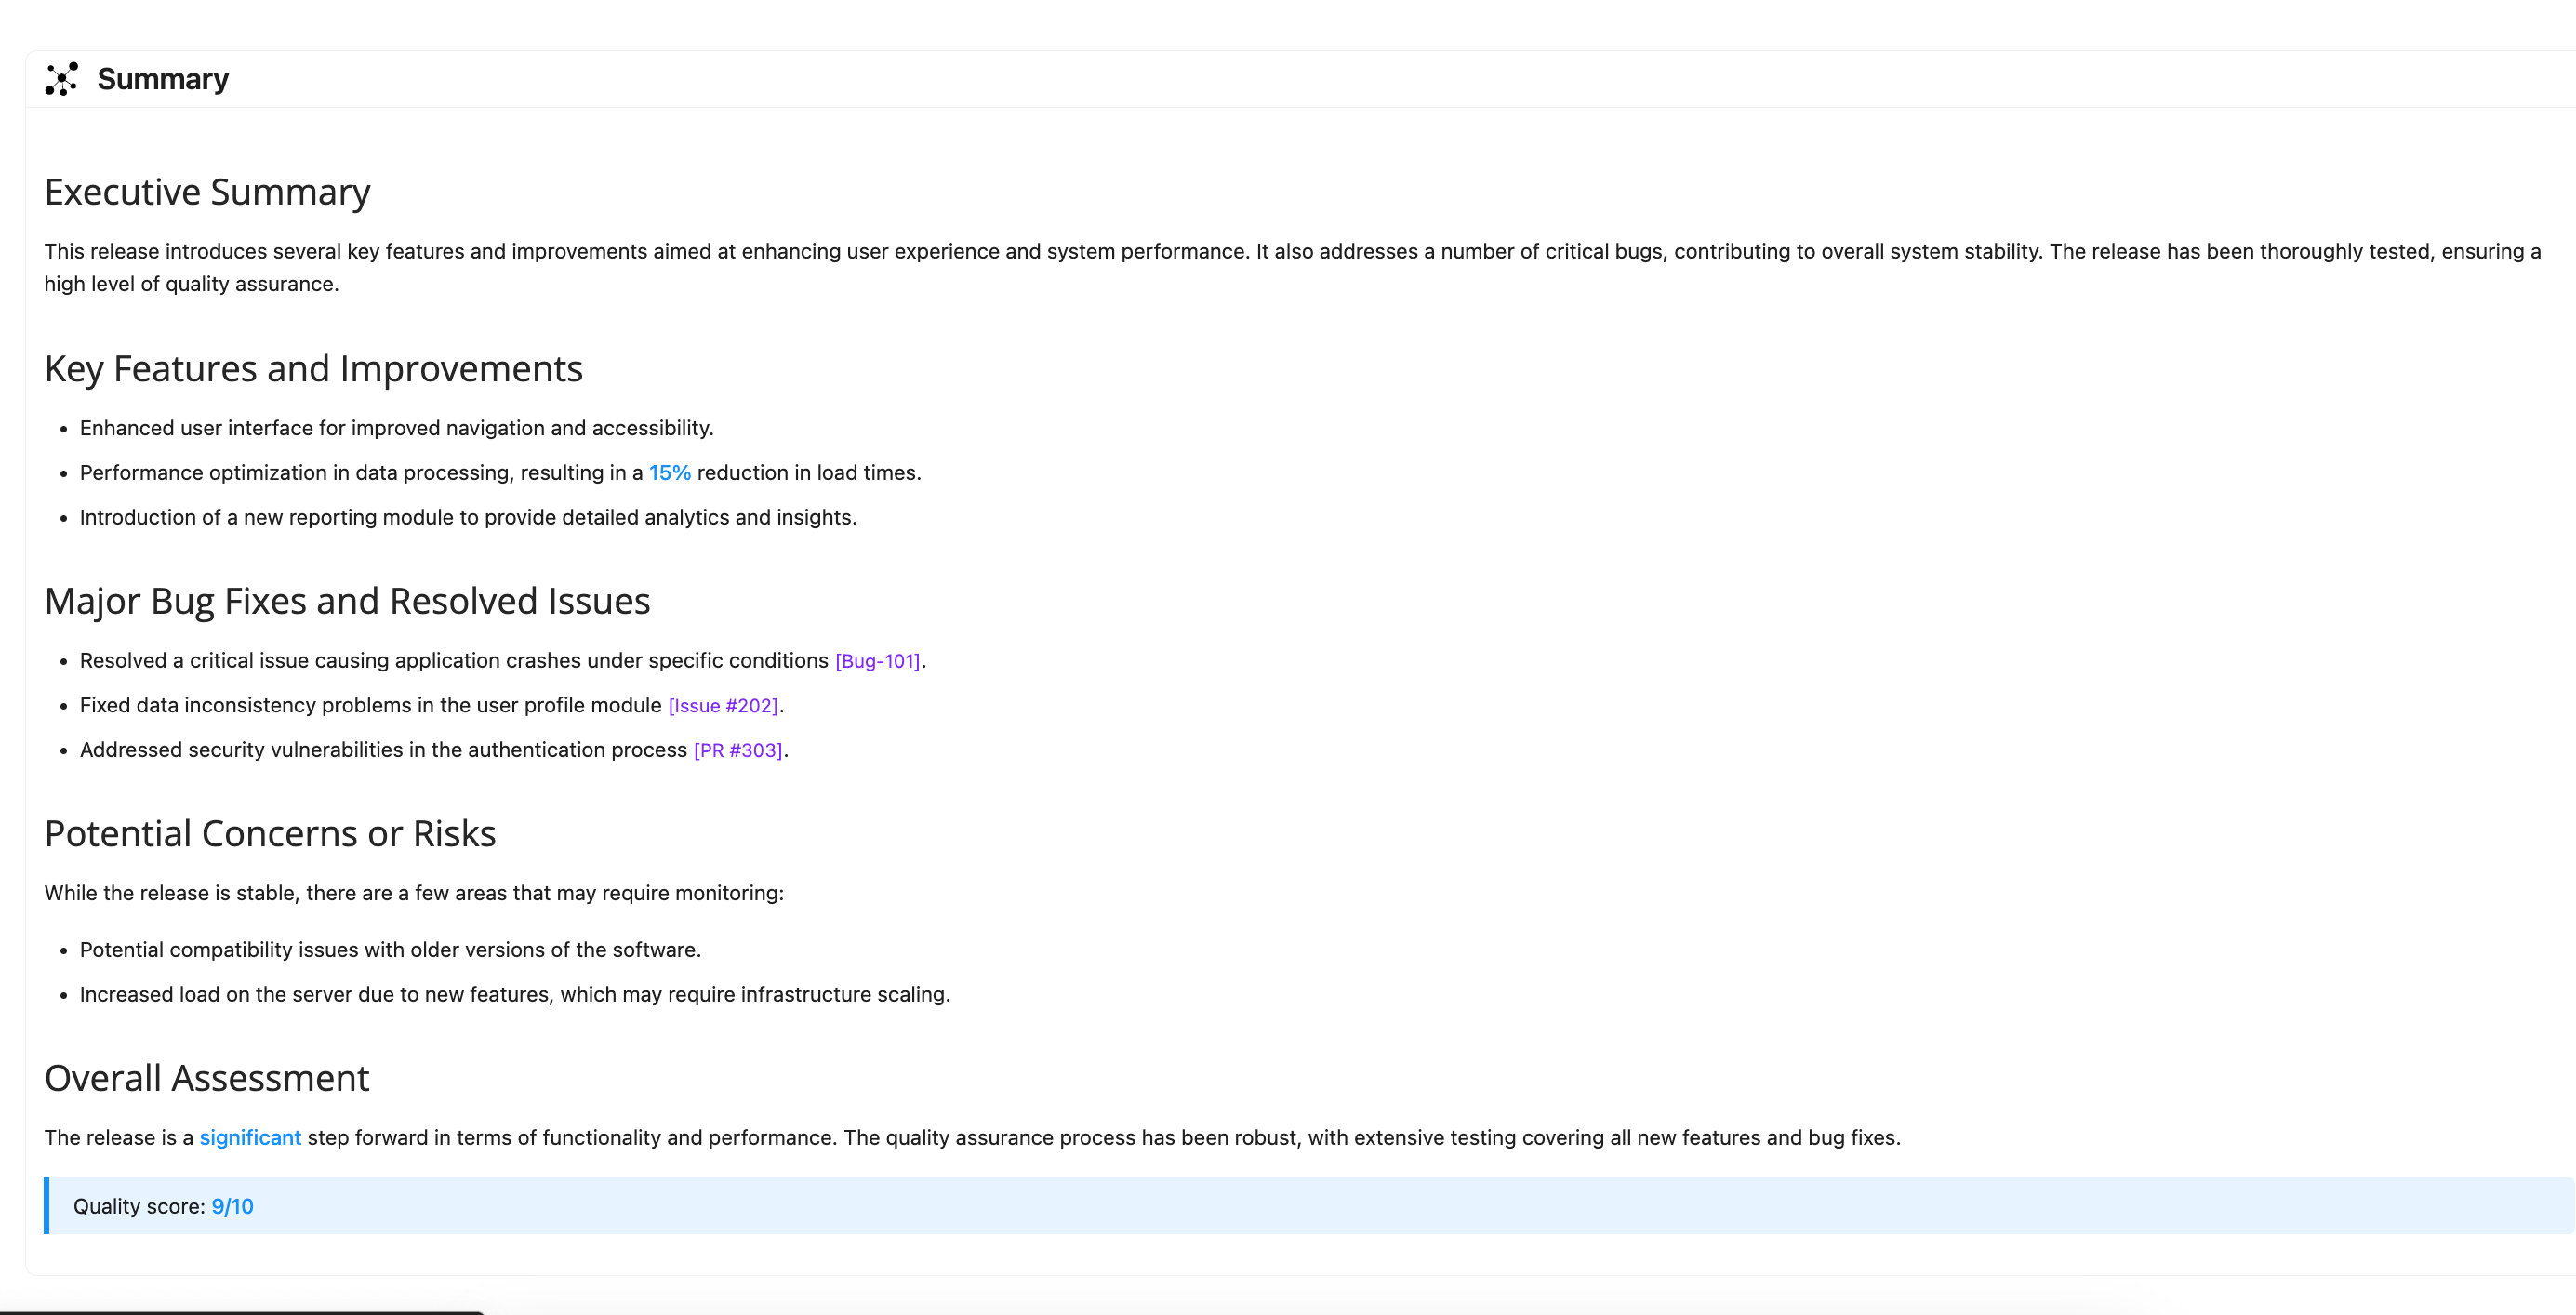
AI-Powered Release Report Summary
Our intelligent report summary component analyzes release data and presents key insights through a modern UI. This feature enables stakeholders to quickly assess release impact, quality, and notable changes without wading through lengthy detailed reports.
Pre-requisite Test Case
This powerful new feature allows one test case to specify another as its pre-requisite. When a test case is deployed, its pre-requisite test case executes first.
When multiple test cases share a common pre-requisite and are deployed together, the pre-requisite executes only once throughout the entire RunID (run session), improving efficiency.
The system intelligently prevents cyclic dependencies during both link time and deployment time.
Background:
- Testers typically need pre-test setup like data preparation or environment configuration. Previously, users relied on set re-ordering to ensure pre-setup tests ran first.
- Some test sets contain multiple test case groups with their own pre-requisites.
- Test cases with pre-requisites may appear in multiple sets.
These factors previously made it challenging to debug or run test cases with pre-requisite steps. Our solution streamlines this process completely.
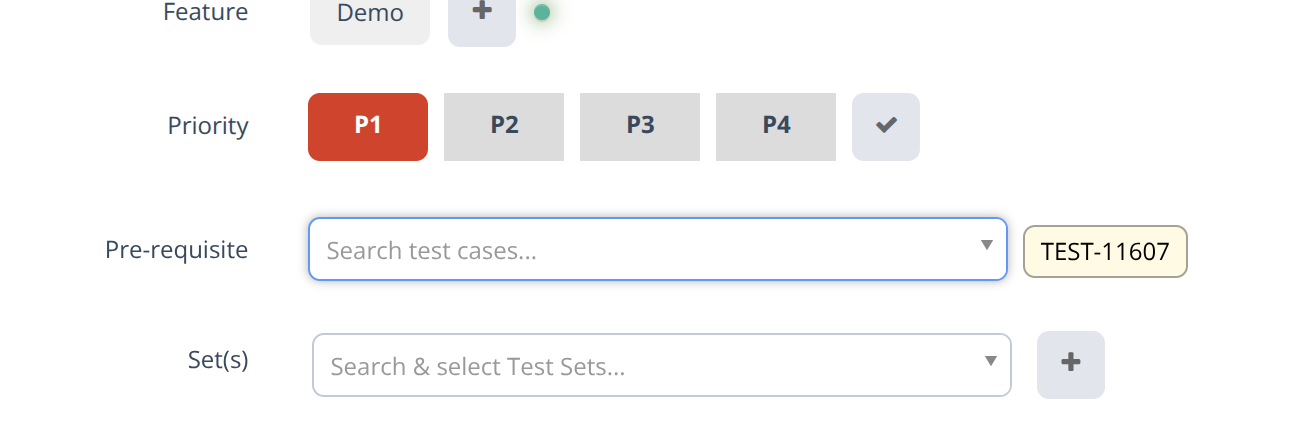
Pre-requisite search in test case details tab:
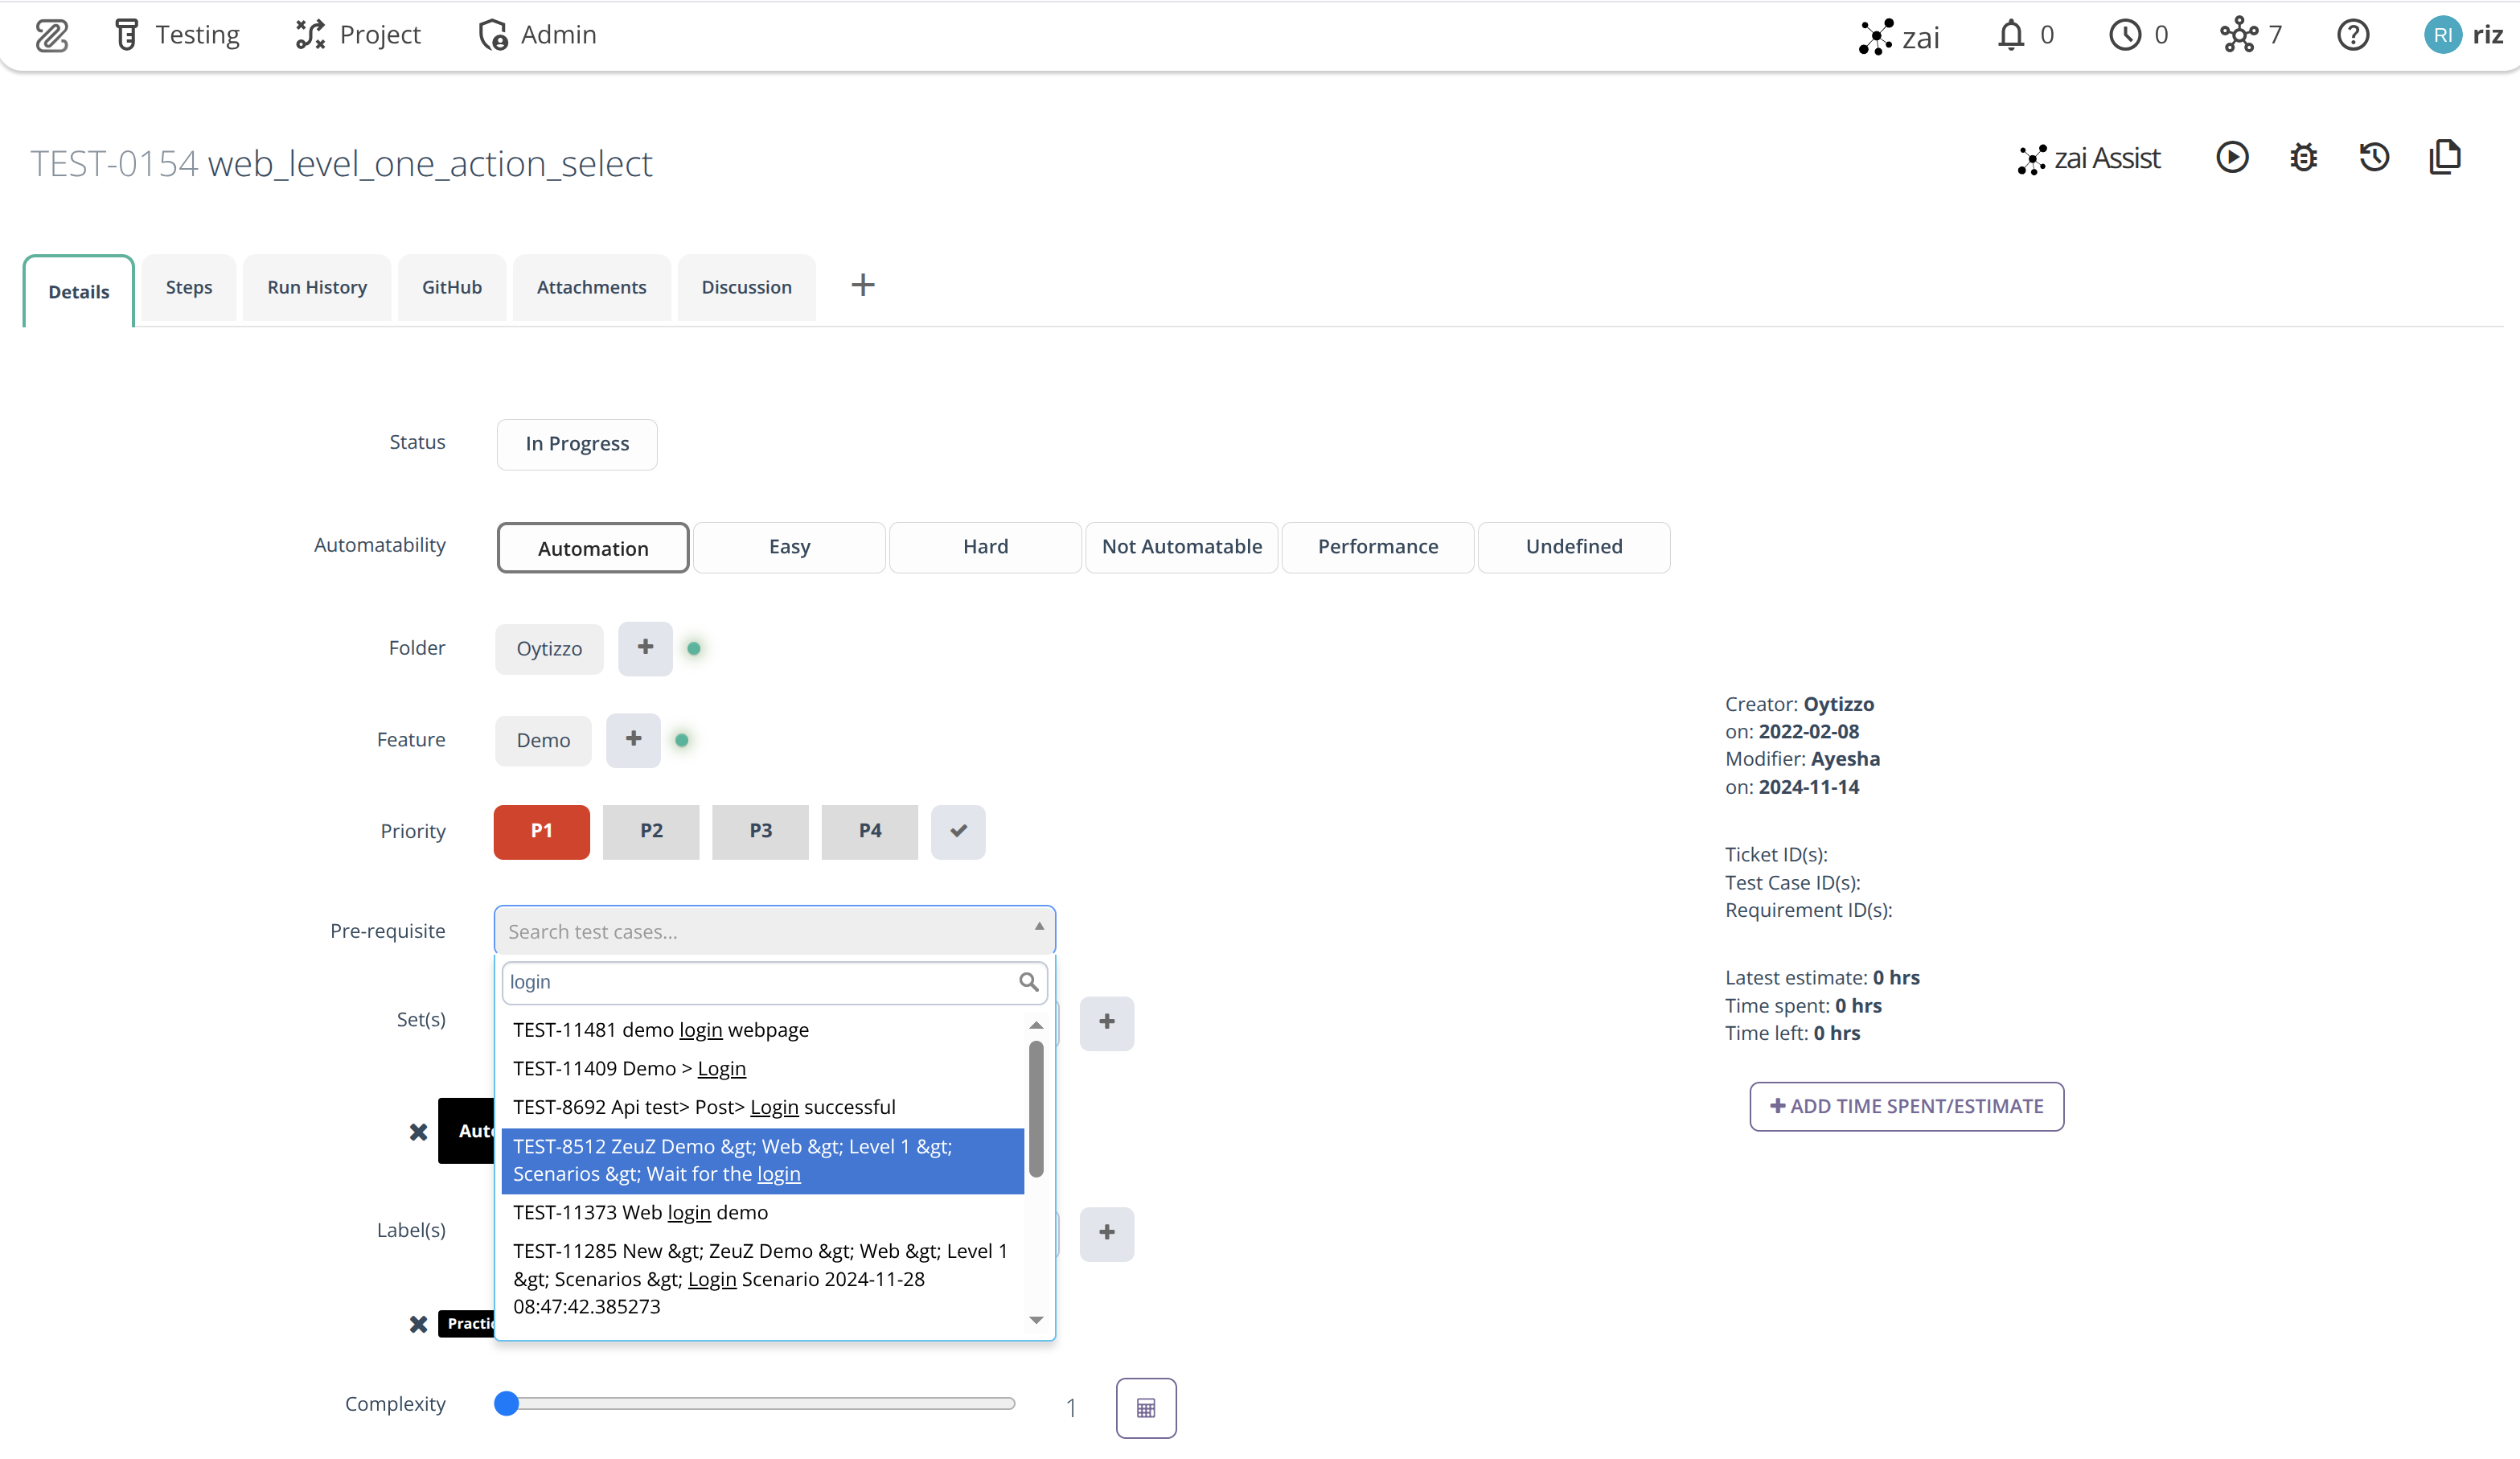
Pre-requisite, once selected:
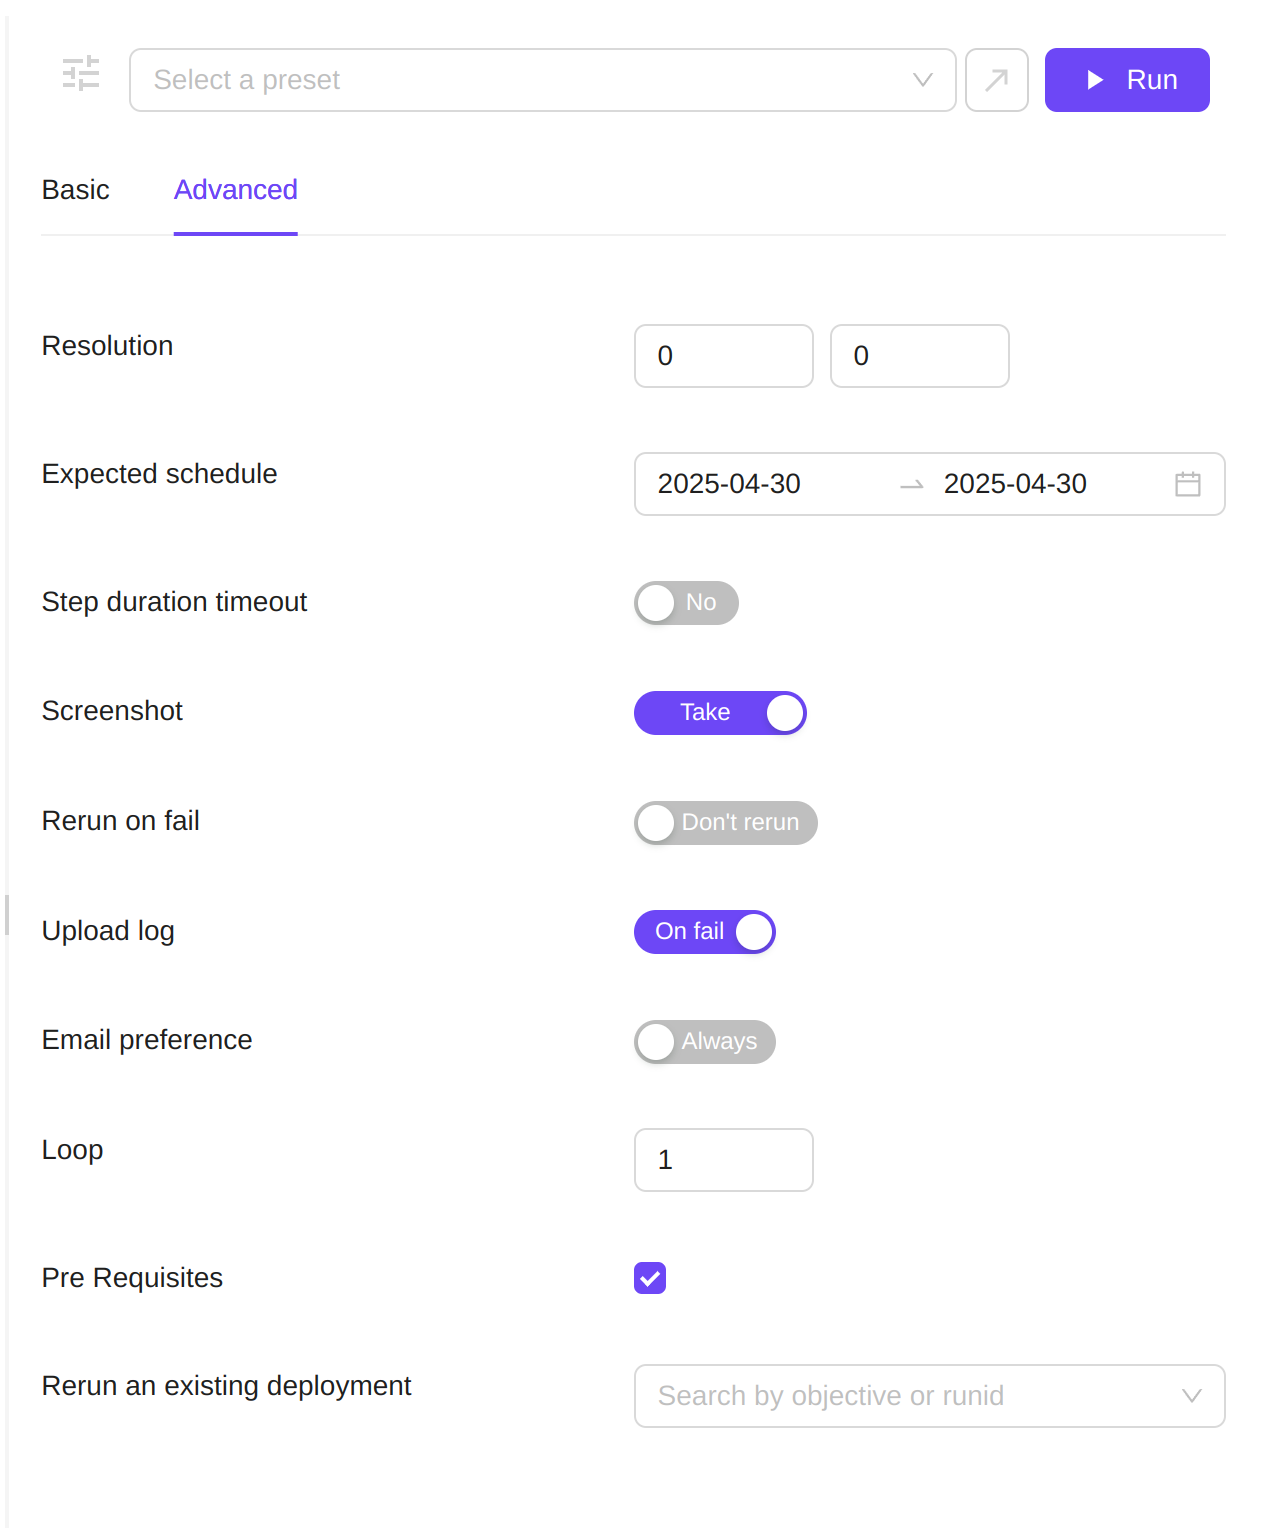
Rerun and pre-requisite selection from Testing > Run tests page:
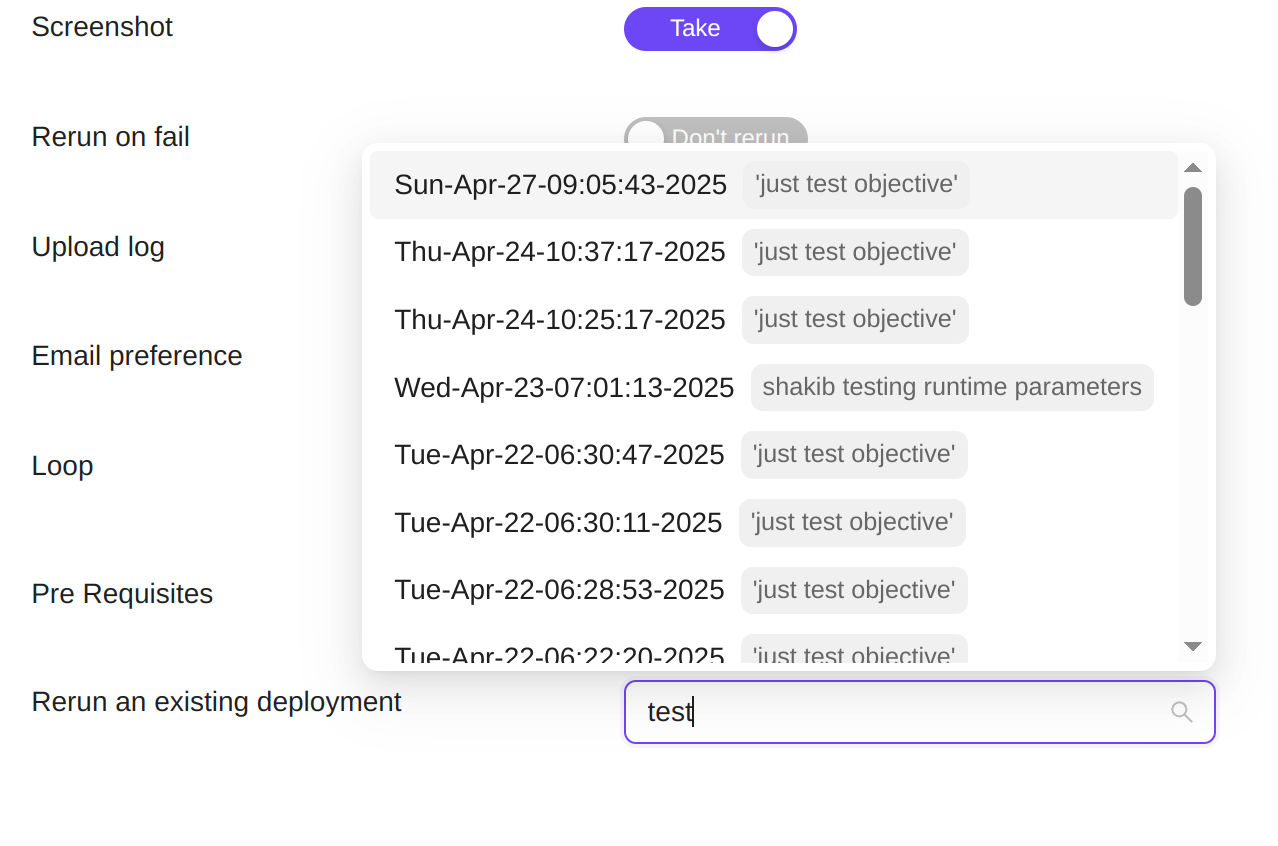
Rerun an Existing RunID
Users can now re-run an existing RunID or selected test cases within a RunID, addressing common operational challenges:
- When a test case fails due to a temporary issue, there's no need to rerun an entire test set of 1,000+ cases just to achieve a green RunID status.
- If a node terminates prematurely before sending reports to the server (e.g., due to memory constraints), leaving test cases marked as "submitted" in the RunID, you can now easily rerun just those affected cases.
Search RunIDs for rerun (Testing > Run tests > Advanced settings):
Fail Analysis Report
When multiple test cases fail, identifying root causes and avoiding duplicate bug reports can be challenging. Our Fail Analysis Report solves this by analyzing failed test steps for common failure patterns and grouping them intelligently.
When one test case in a group is fixed, all related test cases should automatically resolve as long as the steps are global, dramatically improving efficiency.
How It Works
Access the report through Testing > Reports > Fail Analysis and create a filter for your analysis.
- Click on Filter to select Milestone, Version, or GitHub parameters
- In this example, we compare Milestone 2.9 with 2.8
- The system generates a comprehensive Fail Test Case Report

Card View Elements:
- Test case title
- Failed test case step
- Failure reason
- Assignee set
- Assignee feature
- Assignee milestone
- Assignee version
- Comment option (anyone can comment and reply)
- Assignee priority
- Assignee label
- Assignee folder
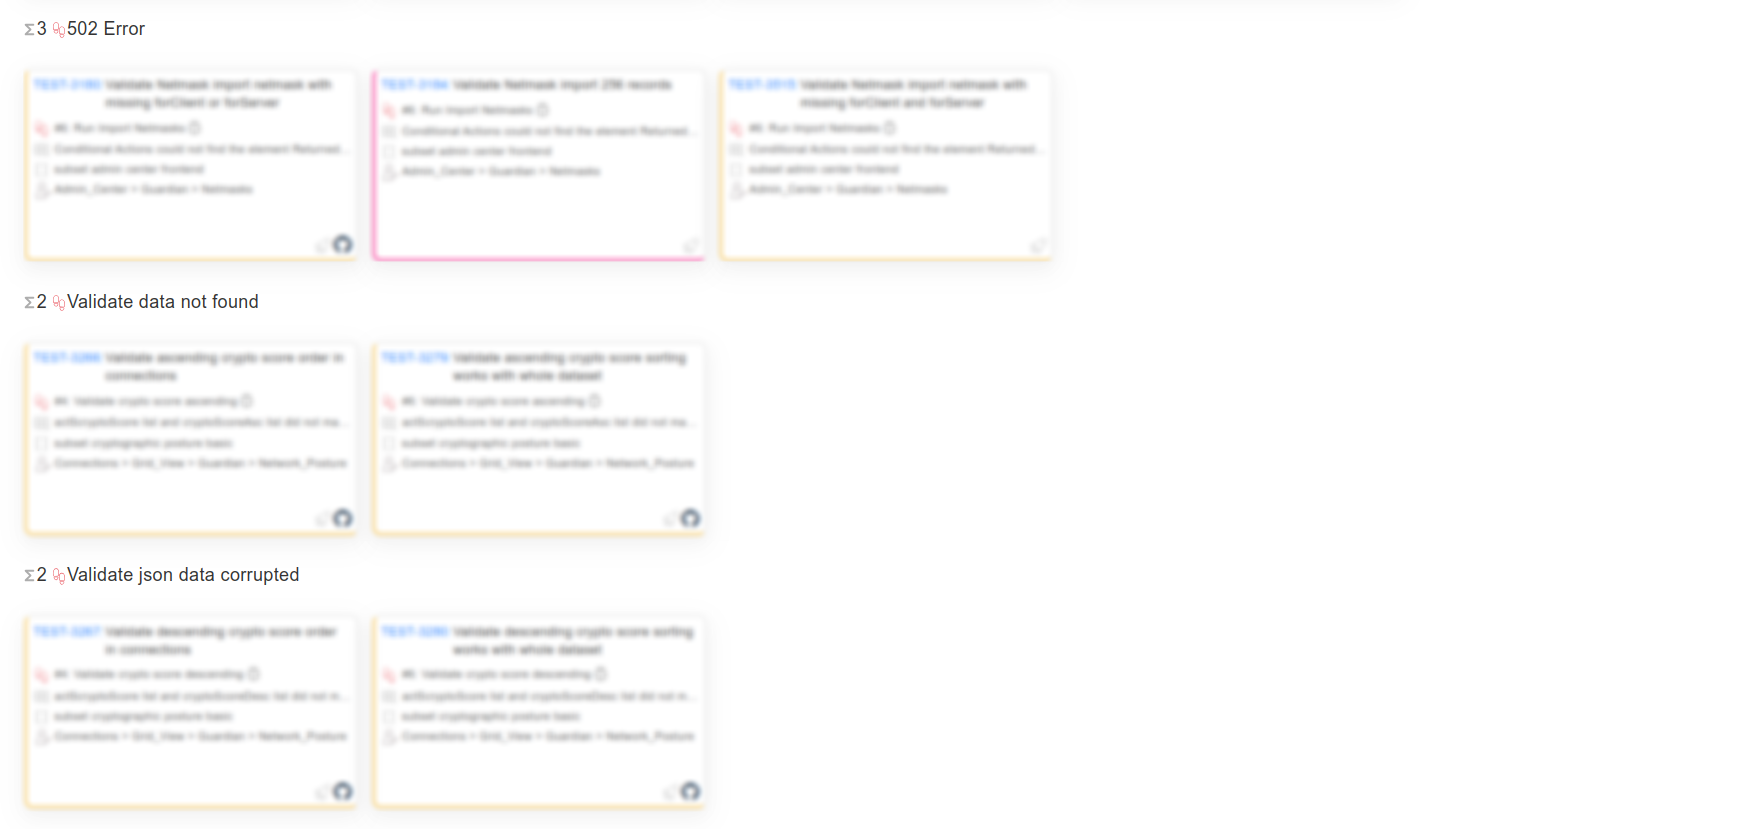
You can also view reports categorized by failure type.

- Track pass/fail statuses at the top of the report
- Group reports by:
- Failed test case
- Set
- Assignee
- Switch between the Fail tab and the GitHub tab to find linked test cases with GitHub issue filters