Proxy Server
Purpose#
This action captures the network log of a webpage during automated testing. It records all network requests and responses, enabling testers to analyze API calls, detect errors, and troubleshoot performance issues.
Scenarios#
Scenario 1#
Title:#
Capture the network log during a login operation
Test case link: TEST-8024 Capture the network log during login
Scenario Overview:#
In this scenario, the network log is captured during the login process to verify API calls and their corresponding responses.
Steps to Follow:#
- Start capturing the network log by using the "Proxy Server" action.
- Perform the login operation by entering the credentials and submitting the form.
- Stop capturing the network log.
- Analyze the log to ensure that no errors occured.
Actions:#
- Start the proxy server.
| Parameter | Type | Value |
|---|---|---|
| port | optional parameter | 8080 |
| action | element parameter | start |
| proxy server | common action | myserver |
- Go to the website.
| Parameter | Type | Value |
|---|---|---|
| wait time to appear element | optional parameter | 10 |
| add argument | element parameter | ['--proxy-server=http://localhost:8080','--ignore-certificate-errors'] |
| go to link | selenium action | https://demo.zeuz.ai/web/level/one/scenerios/login |
- Use the "Proxy Server" action before performing the login operation.
- Stop the log capture after the login operation is complete.
Expected Result:#
- The network log accurately captures all requests and responses made during the login process.
Common Errors and Fixes:#
- Error: The network log fails to capture all requests.
- Fix: Ensure that the action is started before initiating any network activity.
Additional Tips for this Action#
- Use the network log to debug failed API calls by analyzing the response status codes.
- Combine this action with the "Wait for Element" action to ensure that all network captivity is captured during dynamic page loads.
Error Handling for Capture network log#
Common Problems and Their Fixes:#
- Problem: The network log is either empty or incomplete.
Possible Cause: The action was started too late.
How to Fix: Start capturing the network log before initiating any activity on the page.
General Error Handling Tips#
- Verify that the log capture starts and stops at the appropriate times to include all relevant requests.
- Use browser developer tools to cross-check the captured log for completeness.
- Filter the network log to focus on requests relevant to the test case.
Action documentation of Proxy Server#
Description#
This action captures the network log of a webpage during automated testing, recording all network requests and responses. It allows testers to analyze API calls, detect errors, and troubleshoot performance issues, and stores the data in a CSV file.
Setup#
For Mac OS#
- Ensure that the mitmproxy module is installed.
- Then run this command
For Ubuntu - Chrome#
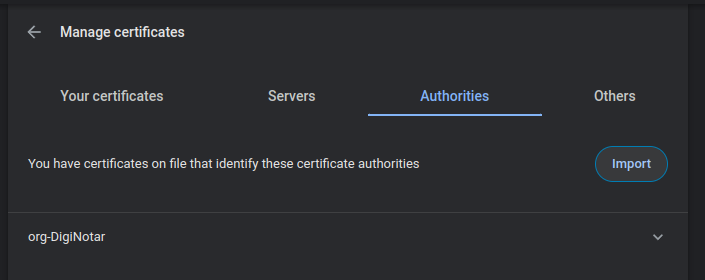
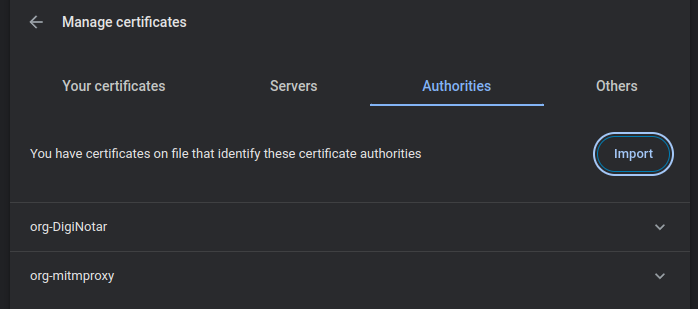
- Open the Chrome browser and navigate to
chrome://settings/certificates. - Click on the Authorities tab and then click the Import button.
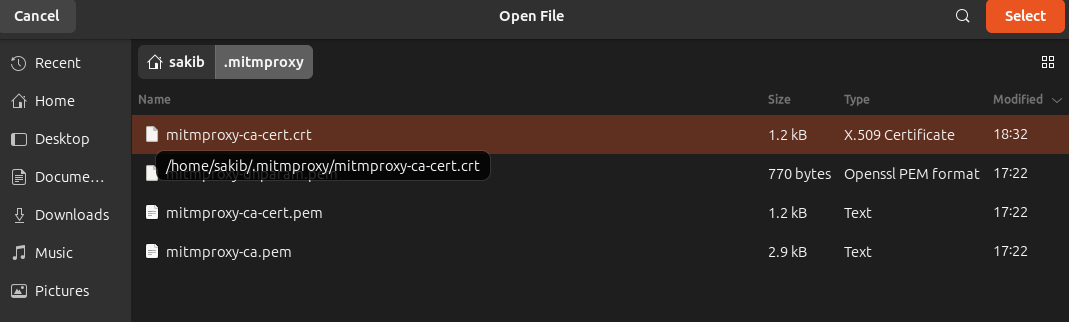
- Select the
mitmproxy-ca-cert.crtfile located in your~/.mitmproxydirectory.
- Check all the boxes and then click OK.
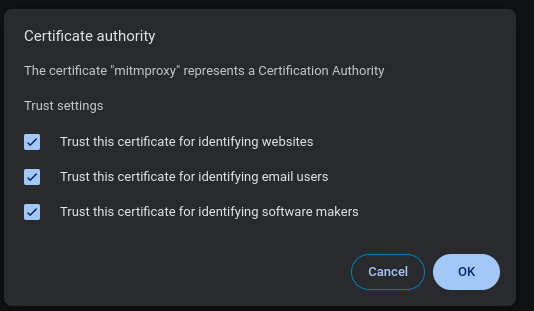
- Verify that the certificate has been added.
For Windows#
Alternative#
Use the ZeuZ test case to run the proxy and visit the mitm.it website using the "Go to Link" action in debug mode. Then, download the .cer file for Windows.
- Double-click
.p12file to start the import wizard.
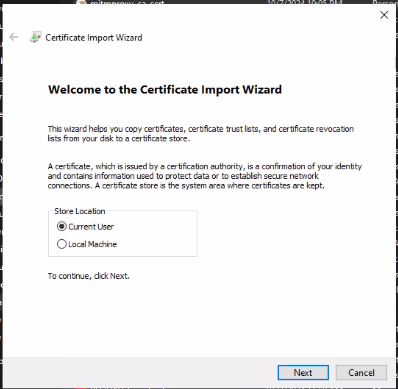
- Select a certificate store location, which determines who will trust the certificate - either only the current Windows user or everyone on the machine. Then, click Next.
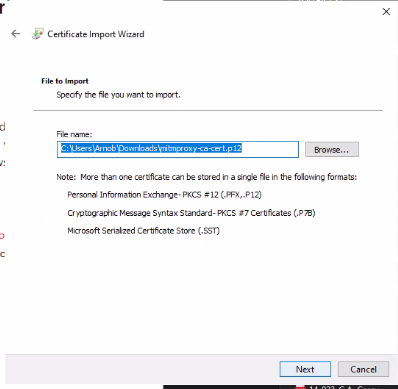
Click Next again.
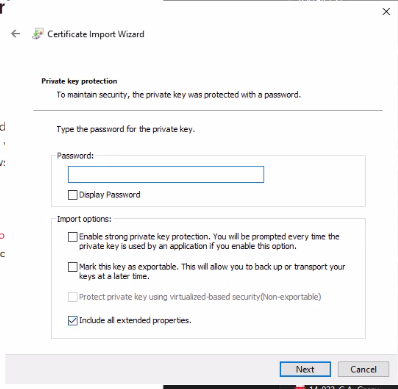
Leave the Password field blank and click Next.
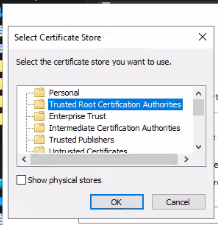
- Select Place all certificates in the following store, then click Browse, and select Trusted Root Certification Authorities.
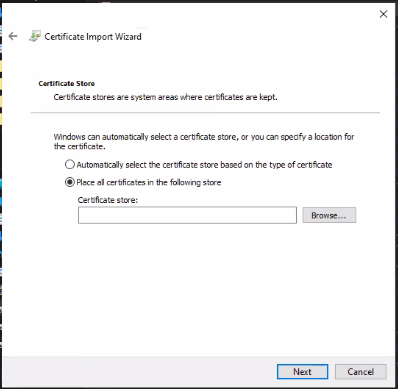
- Click OK, then click Next.
Click Finish.
Click Yes to confirm the warning dialog.
How to use this action:#
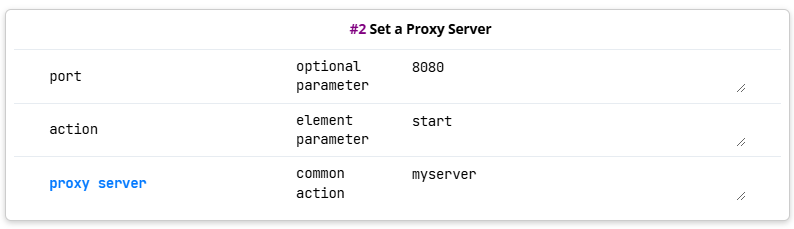
- A new action has been added to start a proxy server. By default, the port is set to 8080, but the user can change it.
| Parameter | Optional Parameter | Value |
|---|---|---|
| port | optional parameter | 8080 |
| action | element parameter | start |
| proxy server | common action | myserver |
note
You can use your own port number. To find a free port number, follow these steps:
For Windows: Write this command
For Ubuntu: Write this command
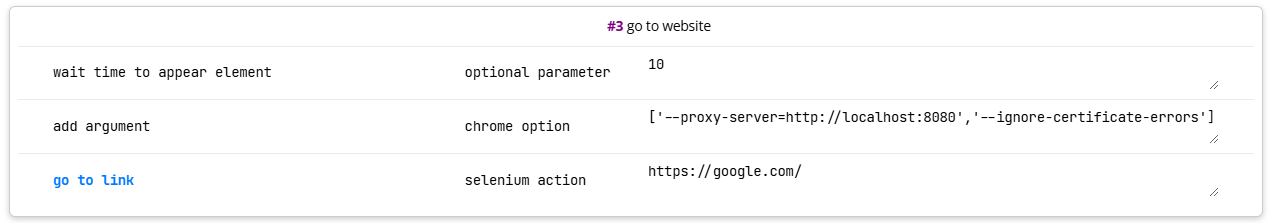
- Use the arguments in the "go to link" action to make the request go through the proxy server.
| Parameter | Optional Parameter | Value |
|---|---|---|
| wait time to appear element | optional parameter | 10 |
| add argument | chrome option | ['--proxy-server=http://localhost:8080','--ignore-certificate-errors'] |
| go to link | selenium action | https://google.com/ |
- And for stopping the server, use the corresponding action.
| Parameter | Optional Parameter | Value |
|---|---|---|
| proxy server | common action | myserver |
| action | element parameter | stop |

note
If you start the proxy server on a specific port, remember to stop the proxy server when it is no longer needed.
Output#
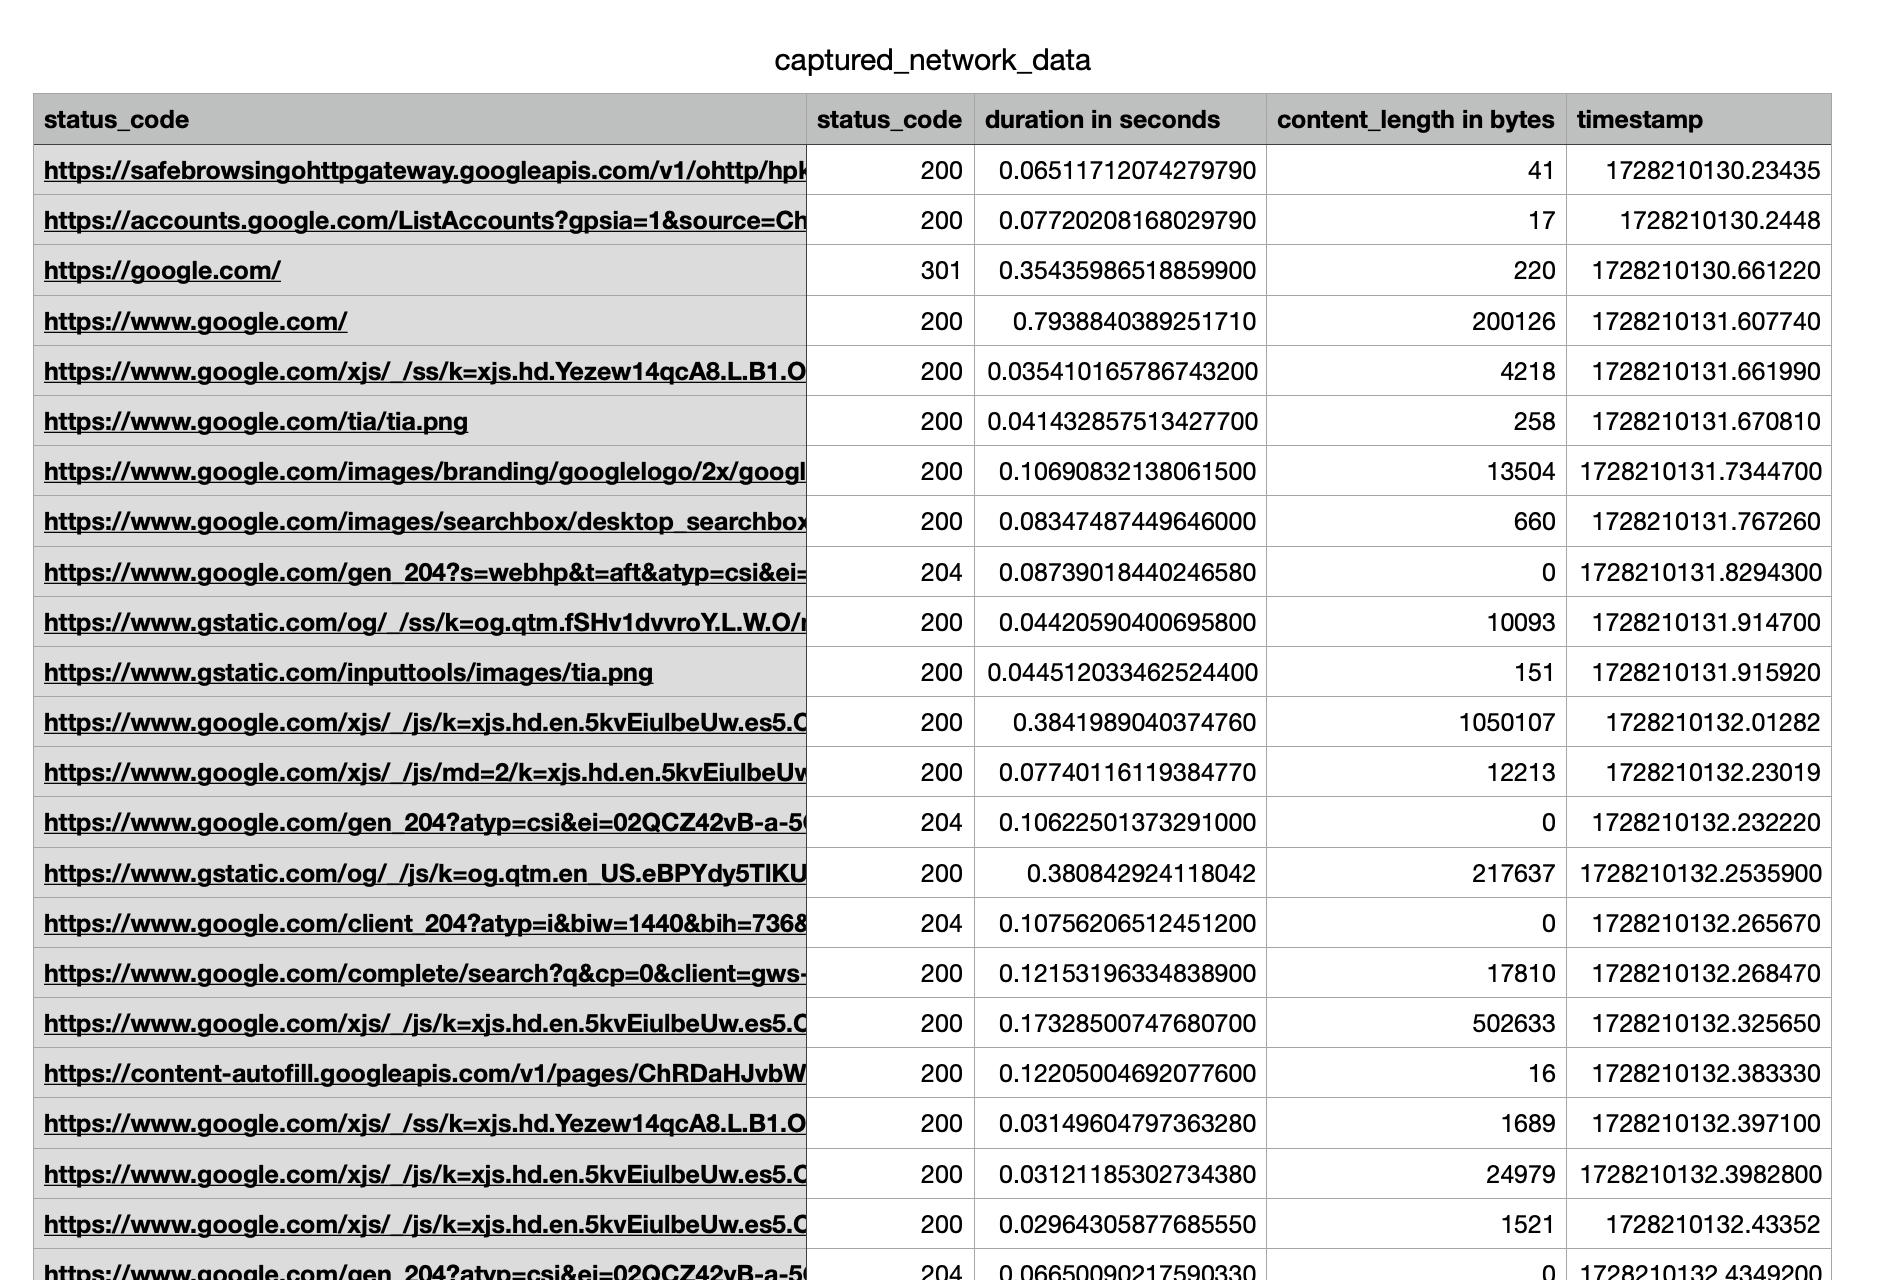
The output will be saved into a CSV file. The output will be stored in the AutomationLog folder, or the log file associated with the RunID will contain the traffic information. During debugging, the exact file path can be found in the captured_network_file_path key of the server variable, which corresponds to the value of the proxy server parameter in the action.
- For finding the file path you have to write
myserver["captured_network_file_path"].

- The output should look like this: